
Claude Opus 4.6 can work for twelve hours. It can work reliably for seventy minutes. Mythos and likely Fable 5 can work for 16 hours at 50% correctness and 2-3 hours at 80%.
Both numbers describe the same model doing the same kind of work, measured by the same organization. The gap between them is a factor of five to ten, and understanding why it exists tells you more about where AI is going than any benchmark leaderboard.
It also explains a pair of facts that look contradictory. In the first week of August 2026, OpenAI published solutions to ten mathematical problems that had been open for at least a decade — including the first construction of a non-sofic group, a question that had stood unanswered since 1999. The compute cost of finding those solutions was about two thousand dollars. That same week, thousands of companies were failing to get AI agents to reliably handle their customer support queues.
Both things are true. The reason is the same.
What the numbers mean
An organization called METR measures something they call a time horizon. The idea is simple. Take a large set of real software tasks. For each one, estimate how long it takes a skilled human expert. Then run an AI model on all of them and see what fraction it completes correctly.
You get a curve: the longer the task, the lower the success rate. From that curve you can pull out a single summary number — the task length at which the model succeeds half the time. That’s the 50% time horizon. For Opus 4.6, it’s about twelve hours. For an early version of Claude Mythos Preview, it’s about seventeen hours, which is more than a full human workday.
You can also ask a stricter question: how long a task can the model complete eight times out of ten? That’s the 80% time horizon. For Opus 4.6, it’s about seventy minutes.
Twelve hours versus seventy minutes. Same model, same tasks. The only difference is how sure you want to be.
No business hands over a day of work to a system that gets it right half the time. Reliability, not capability, is what converts intelligence into economic impact.
The obvious explanation, and why it’s wrong
Here’s the intuitive theory of why AI fails on long tasks. The model is working along, and at every moment there’s some small fixed chance it makes a fatal mistake — misreads a file, wanders down a wrong path, forgets something from an hour ago. The longer it works, the more chances to go wrong. Like a radioactive atom with a constant chance of decaying each second.
The philosopher Toby Ord worked out what this model predicts, and it’s usefully specific. If failure arrives at a constant rate, then success probability drops exponentially with task length. A model with a 50% chance of completing Monday’s work has only a 25% chance of completing Monday’s and Tuesday’s. And — this is the useful part — the 80% horizon should land at almost exactly one third of the 50% horizon.
That ratio isn’t a guess. It falls out of the arithmetic and statistics (0.8 X 0.8 = 0.64 correct and 0.36 wrong). It doesn’t depend on which model you’re testing or how good it is.
So it gives us a free measuring stick. If a real model’s ratio isn’t 3-to-1, we learn something specific about how it’s actually failing:
If the curve is steeper than predicted, errors are compounding. A mistake at hour two corrupts hours three through twelve. The fix would be error correction — checkpoints, verification, the ability to notice you’ve gone wrong and back up.
If the curve is flatter than predicted, something else is going on entirely.
Opus 4.6’s ratio is 10-to-1, not 3-to-1. Mythos ratio might be about 6 to 1. Both are much worse than the simple theory predicts. And when you plot the actual curve, it’s flatter, not steeper. However, the newer model is improving on duration and reliability.
What’s really happening
Look at the raw data — the individual tasks rather than the fitted curve — and the picture resolves.
Past about an hour of task length, the results don’t spread out smoothly. They clump. At any given duration you find a cluster of tasks the model gets right essentially every time, sitting right next to a cluster it gets wrong essentially every time, with relatively few in between.
That is not a gentle slope of increasing difficulty. It’s two separate populations of tasks occupying the same space on the chart. The smooth curve everyone quotes is a line drawn through a bimodal cloud.
METR found the same thing directly: on tasks taking a human expert 90 minutes to 3 hours, a GPT-5 agent succeeded 100% of the time on about a third of them, failed 100% of the time on about a third, and was genuinely unpredictable on the rest.
So the model isn’t running out of stamina. It’s hitting walls. There are kinds of tasks it simply cannot do, and their presence in the mix caps the achievable success rate no matter how you slice it by duration. If 20% of tasks are impossible for a model, then an 80% success rate is unreachable at any task length — which is exactly why the 80% horizon collapses to seventy minutes while the 50% horizon sits at twelve hours.
The crossover, and why it’s good news
Plot the real curve against the constant-hazard prediction and they cross at around six to eight hours.
Below the crossover, the real model does worse than the simple theory predicts. Those are the walls — tasks it should be able to handle at that length but can’t.
Above the crossover, the real model does better. If failure were a per-minute dice roll, a hundred-hour task would be essentially hopeless. The real curve says roughly one in five still succeeds.
Read that second half carefully, because it inverts the standard narrative. The popular story is that AI agents fall apart on long work — they drift, lose the plot, forget the goal. The data says the opposite. Once a model can do a kind of task at all, making it longer doesn’t destroy performance. Length is not the enemy.
The enemy is a hard boundary of task types. And boundaries move with capability, which is the thing that has been improving fastest and most predictably.
The actual gate: do you know whether it worked?
Everything above is about whether the model can do the work. There’s a second question that turns out to matter more:
Can you tell whether it did?
Consider two situations.
In the first, you ask a model to prove a mathematical theorem, and you have a proof checker — a program like Lean that mechanically verifies every logical step. If the proof compiles, it is correct. Full stop. No human judgment, no ambiguity.
Now a 5% success rate is fine. Run the model twenty times, throw away nineteen failures, keep the one that passes. You never see the failures. The economics are set by the cost of trying, and trying is cheap.
This is exactly what happened with OpenAI’s ten mathematical results. Not because math is easy — these were problems that had defeated the field for decades. But because in formal mathematics, checking is free and unambiguous. A low success rate against a perfect checker is a solved problem.
In the second situation, you ask a model to add a feature to your product. It writes code. The tests pass. Did it work?
You don’t know. Passing tests means it didn’t break anything you thought to check. It doesn’t mean the feature is right, that it handles the case you forgot, or that it does what you actually meant rather than what you managed to write down.
Now the success rate matters enormously, because every failure that slips through the checker becomes your problem later, and every failure you catch costs a human review cycle. The whole advantage of automation evaporates if a person has to carefully read everything anyway.
This is the gate. Not intelligence. Verification.
There’s a useful piece of theory here from an unrelated field. In fault-tolerant computing, there’s a threshold result: if your error rate after correction is below a certain level, you can run arbitrarily long computations with only modest overhead. Above that level, the cost explodes and long computations are impossible at any budget. The transition is sharp, not gradual.
Agents work the same way. Whether long autonomous work is cheap or impossible depends discontinuously on how good your checker is. And critically: your checker’s quality sets a floor that no amount of model improvement can break through. If your verification wrongly approves 5% of bad work, then 95% correct is your ceiling, forever, no matter what model you run.
Where each field sits
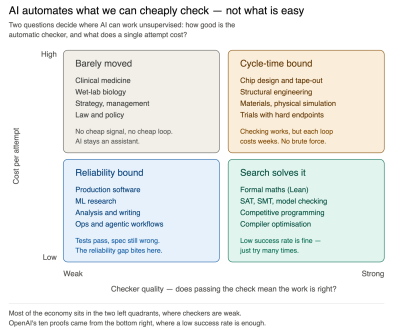
This gives you a cleaner map of AI’s economic impact than “which tasks are hard.”
Two questions –
how good is your automatic checker and
how expensive is each attempt?
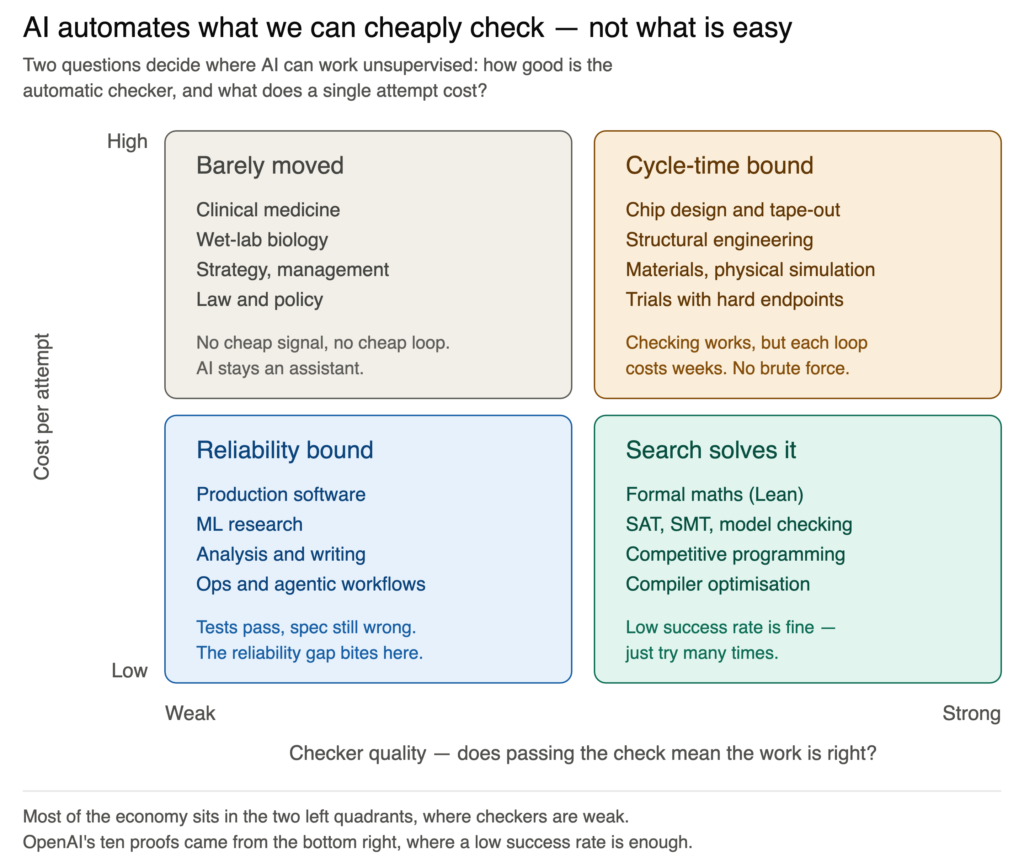
Good checker, cheap attempts. Formal mathematics, theorem proving, SAT solving, chip verification, compiler optimization, competitive programming. Automation is essentially available now. Low success rates don’t matter. This is where the ten proofs came from.
Good checker, expensive attempts. Chip design through fabrication, structural engineering, physical simulation, clinical trials with hard endpoints. The checking works, but each loop costs weeks and real money, so you can’t brute-force it. Progress here is gated by cycle time, not intelligence.
Weak checker, cheap attempts. Production software, machine learning research, analysis, writing, most agentic workflows. Tests pass but the specification is still wrong. This is where the low reliability causes the most problems.
Weak checker, expensive attempts. Clinical medicine, wet-lab biology, strategy, management, law, policy. No cheap signal, no cheap loop. AI is an assistant here and will be for a while.
Most of the economy’s value sits in those bottom two categories. This is why the automation curve looks so uneven — and why AI can solve a 27-year-old problem in group theory the same month it fails to reliably close support tickets.
Where we are, and where this goes
Formal mathematics moved from AI-assists-human to AI-does-work-and-a-checker-verifies-it. At frontier labs and large tech companies, most new code is AI-written with humans reviewing. The 50% time horizon passed a full human workday.
Crossing now. The ratio between the two horizons appears to be improving — around 10-to-1 for Opus 4.6, possibly closer to 5-to-1 for Mythos Preview.
Mythos’s seventeen-hour figure sits right at the edge of what METR’s current test suite can measure reliably, so some of the apparent improvement may be a measurement ceiling rather than a real gain. Still, it’s the single most informative number to track this year. Meanwhile the 80% horizon is climbing toward a workday — roughly mid-2027 if current trends hold.
Not close. Unsupervised work in domains without good checkers. Writing down precisely what you want remains most of the job, and no amount of model capability removes that, because specification is the work.
Looking further out, with wide error bars. The next hardware generation of models should mainly shrink the “always fails” pile, because raw capability is what moves hard walls. Expect reliable horizons in the eight-to-twenty-four-hour range and benchmarks that need rebuilding. What scale alone probably won’t fix is the ratio — closing that requires the model to learn from its own mistakes during a task rather than starting fresh every time. Nothing in production does this today, largely because a model that learns from unverified experience compounds its own errors, which turns the flat failure curve into the steep one.
Human work will be – Is the AI work right? Is AI work good ? This is for work where we cannot have automated verification.
There is also key human work, involvement and approvals in the planning and goal setting stages.
Humans take responsibility and can fund the work and take ownership of the results.
The generation after next could be where we get leaps in capability. IF continual learning works, long autonomous work becomes more trustworthy even where checking is imperfect. If it doesn’t, we get extraordinarily capable systems that remain unreliable on open-ended work — enormous value inside well-checked domains, and organizations still unable to hand over unsupervised projects.
What to watch
The ratio between the 50% and 80% horizons. Falling toward 3-to-1 means error correction is being solved. Staying flat means capability keeps rising without becoming fully usable and reliable.
The fraction of tasks a model fails 100% of the time. This is the wall, measured directly. METR publishes per-task data; nobody has charted this across generations, and it would settle the mechanism.
The 80% horizon crossing eight hours. Not the 50% number. This is the threshold for handing over a workday.
Attempts-per-solve in checked domains. The honest cost metric, versus the marketing metric of what the winning run cost.
Whether any of those ten proofs gets retracted. They ship with machine-checkable certificates, which is a much stronger bar than AI math has previously cleared. Six months without a retraction would be significant.

Brian Wang is a Futurist Thought Leader and a popular Science blogger with 1 million readers per month. His blog Nextbigfuture.com is ranked #1 Science News Blog. It covers many disruptive technology and trends including Space, Robotics, Artificial Intelligence, Medicine, Anti-aging Biotechnology, and Nanotechnology.
Known for identifying cutting edge technologies, he is currently a Co-Founder of a startup and fundraiser for high potential early-stage companies. He is the Head of Research for Allocations for deep technology investments and an Angel Investor at Space Angels.
A frequent speaker at corporations, he has been a TEDx speaker, a Singularity University speaker and guest at numerous interviews for radio and podcasts. He is open to public speaking and advising engagements.