
Damage from two strong earthquakes that rattled Southern
California on July 4 and July 5 – a magnitude 6.4 and a magnitude 7.1, respectively – can be
seen from space. The epicenter of the quakes was near the city of Ridgecrest, about
150 miles (241 kilometers) northeast of Los Angeles. According to the U.S.
Geological Survey, the 7.1 quake was one of the largest to hit the region in
some 40 years.
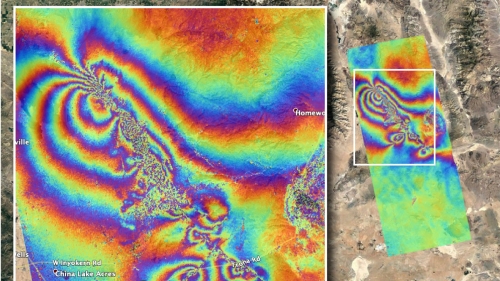
The Advanced Rapid Imaging and Analysis (ARIA) team at
NASA’s Jet Propulsion Laboratory in Pasadena, California, used synthetic
aperture radar (SAR) data from the ALOS-2 satellite to produce a map showing
surface displacement from the earthquakes. The post-quake imagery was acquired
on July 8, 2019, and compared with April 8, 2018, data from the same region.
Each color cycle represents 4.8 inches (12 centimeters)
of ground displacement either toward or away from the satellite. The linear features that cut the color
fringes in the southeast indicate likely locations of surface rupture caused by
the earthquakes, and the “noisy” areas in the northwest may indicate
locations where the ground surface was disturbed by them.
The
USGS reported over 1,000 aftershocks in the region following the July 5
earthquake. State and federal scientists, including those from the California
Geological Survey and USGS, are using this surface deformation map in the field
for assessing the damages and mapping the faults that broke during the two
major earthquakes as well as the thousands of aftershocks.
In the
aftermath of the earthquakes, NASA’s Earth Science Disasters Program is in
communication with the California Earthquake Clearinghouse, which is
coordinating response efforts with the California Air National Guard, the USGS and
the Federal Emergency Management Agency. NASA analysts are using data from
satellites to produce visualizations of land deformation and potential
landslides, among other earthquake impacts, and are making them available to
response agencies. NASA’s Disasters Program promotes the use of satellite
observations in predicting, preparing for, responding to and recovering from
disasters around the world.
The Japanese Aerospace Exploration Agency (JAXA) provided
the ALOS-2 data for the production of the map. The ARIA team’s analysis was
funded by NASA’s Disasters Program.
For more information about
ARIA, visit:
For more information about
NASA’s Disasters Program, visit:
News Media Contact
Esprit Smith
Jet Propulsion Laboratory, Pasadena, Calif.
818.354.4269
esprit.smith@jpl.nasa.gov
2019-137