

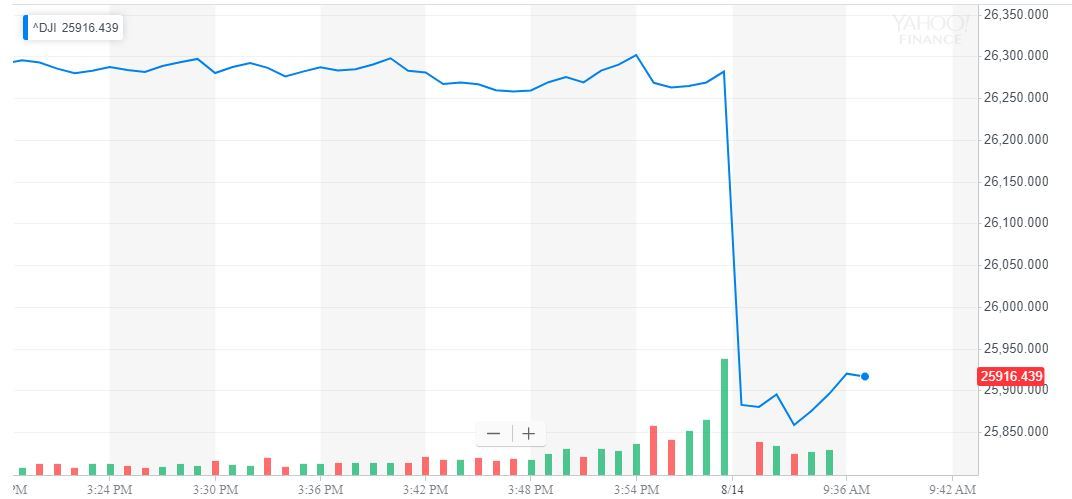
By CCN Markets: The Dow whipsawed back into decline on Wednesday, completely reversing Tuesday’s massive recovery.
What triggered the plunge? The bond market just flashed a warning signal that has preceded every recession for the past five decades.
Dow Plummets; S&P 500 and Nasdaq Struggle
All of Wall Street’s major indices suffered steep declines at the opening bell. The Dow Jones Industrial Average plunged 400 points at the open. A minor bounce reduced that decline to 351.99 points or 1.34%, bringing the DJIA to 25,927.92.
The S&P 500 slid 38.23 points or 1.31% to 2,888.09. The energy sector led the retreat, plummeting 2.59% as a group.
The Nasdaq suffered the worst decline, falling 120 points or 1.5% to 7,896.32.
Yield Curve Inversion Triggers Recession Alarms, Economic ‘Doom and Gloom’
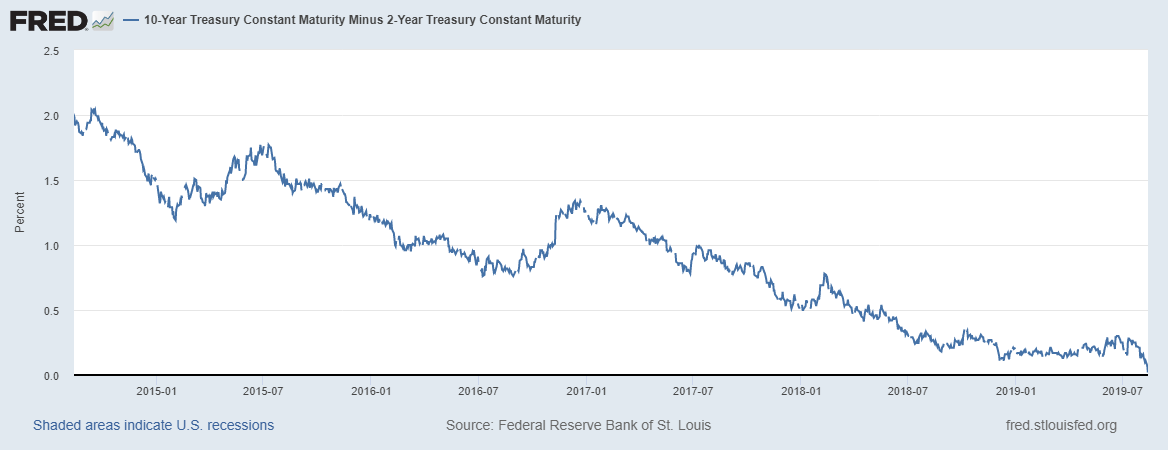
Investors panicked, and stocks plunged, after the main yield curve inverted for the first time since 2007.
A “yield curve inversion” occurs when the yield on a longer-term bond dips below that of a shorter-term note. The “main yield curve” tracks the relationship between 10-year and 2-year bonds.
On Wednesday, 10-year Treasury yields dipped to 1.623%, just below the 1.634% yield on the 2-year note.
U.K. bonds also suffered an inversion, with 10-year yields sliding to 0.475% while 2-year yields ticked up to 0.478%.
Bond yields decline as prices increase, and bond prices increase when nervous investors flock to these safe-haven assets.
According to CNBC, every recession in the past 50 years has been preceded by a main yield curve inversion, though not every inversion was followed by a recession.
US 10-Year minus 2-Year Yield…
Aug ’09: 2.48%
Aug ’10: 2.14%
Aug ’11: 2.10%
Aug ’12: 1.46%
Aug ’13: 2.37%
Aug ’14: 1.98%
Aug ’15: 1.47%
Aug ’16: 0.83%
Aug ’17: 0.89%
Aug ’18: 0.26%
Today: -0.003% (first inversion since Aug 2007)— Charlie Bilello (@charliebilello) August 14, 2019
Why the Dow Jones Might Still Have Major Upside
The inversion doesn’t necessarily mean that stock market bulls should take their ball and go home.
Credit Suisse data indicates that, on average, recessions do not set in until 22 months after a main yield curve inversion.
Moreover, stock prices typically continue to climb for more than a year after an inversion, launching the S&P 500 to average 12-month gains of 12%.
But that doesn’t make it any less of a recession signal, and it suggests that central bank easing will be too little, too late.
“The bond market is saying central banks are behind the curve,” Marc Ostwald, global strategist at ADM Investor Services in London, said in remarks cited by Bloomberg. “It’s all doom and gloom on the global economy.”
Wednesday Market Crash Erases Bullish Sentiment Over Tariff Delay
Wednesday’s panic-driven sell-off reversed the previous session’s spectacular recovery, which saw the Dow surge more than 372 points (1.44%), the S&P 500 climb 1.48%, and the Nasdaq jump 1.95%.
That rally followed the Trump administration’s decision to delay new tariffs on a laundry list of Chinese imports until December. The delay eased pressure on key US stock market bellwethers, including Apple.
According to the South China Morning Post, it also prompted state-run media sources in China to hail the “positive signal” in the White House’s stance on trade negotiations.
Click here for a real-time Dow Jones Industrial Average chart.
This article is protected by copyright laws and is owned by CCN Markets.